mirror of
https://github.com/TriliumNext/Notes.git
synced 2025-07-27 10:02:59 +08:00
3.5 KiB
Vendored
3.5 KiB
Vendored
Metrics
The Trilium Metrics API provides comprehensive monitoring data about your Trilium instance, designed for external monitoring systems like Prometheus.
Endpoint
- URL:
/etapi/metrics - Method:
GET - Authentication: ETAPI token required
- Default Format: Prometheus text format
Authentication
You need an ETAPI token to access the metrics endpoint. Get one by:
# Get an ETAPI token
curl -X POST http://localhost:8080/etapi/auth/login \
  -H "Content-Type: application/json" \
  -d '{"password": "your_password"}'
Usage
Prometheus Format (Default)
curl -H "Authorization: YOUR_ETAPI_TOKEN" \
  http://localhost:8080/etapi/metrics
Returns metrics in Prometheus text format:
# HELP trilium_info Trilium instance information
# TYPE trilium_info gauge
trilium_info{version="0.91.6",db_version="231",node_version="v18.17.0"} 1 1701432000

# HELP trilium_notes_total Total number of notes including deleted
# TYPE trilium_notes_total gauge
trilium_notes_total 1234 1701432000
JSON Format
curl -H "Authorization: YOUR_ETAPI_TOKEN" \
  "http://localhost:8080/etapi/metrics?format=json"
Returns detailed metrics in JSON format for debugging or custom integrations.
Available Metrics
Instance Information
trilium_info- Version and build information with labels
Database Metrics
trilium_notes_total- Total notes (including deleted)trilium_notes_deleted- Number of deleted notestrilium_notes_active- Number of active notestrilium_notes_protected- Number of protected notestrilium_attachments_total- Total attachmentstrilium_attachments_active- Active attachmentstrilium_revisions_total- Total note revisionstrilium_branches_total- Active branchestrilium_attributes_total- Active attributestrilium_blobs_total- Total blob recordstrilium_etapi_tokens_total- Active ETAPI tokenstrilium_embeddings_total- Note embeddings (if available)
Categorized Metrics
trilium_notes_by_type{type="text|code|image|file"}- Notes by typetrilium_attachments_by_type{mime_type="..."}- Attachments by MIME type
Statistics
trilium_database_size_bytes- Database size in bytestrilium_oldest_note_timestamp- Timestamp of oldest notetrilium_newest_note_timestamp- Timestamp of newest notetrilium_last_modified_timestamp- Last modification timestamp
Prometheus Configuration
Add to your prometheus.yml:
scrape_configs:
  - job_name: 'trilium'
    static_configs:
      - targets: ['localhost:8080']
    metrics_path: '/etapi/metrics'
    bearer_token: 'YOUR_ETAPI_TOKEN'
    scrape_interval: 30s
Error Responses
400- Invalid format parameter401- Missing or invalid ETAPI token500- Internal server error
Grafana Dashboard
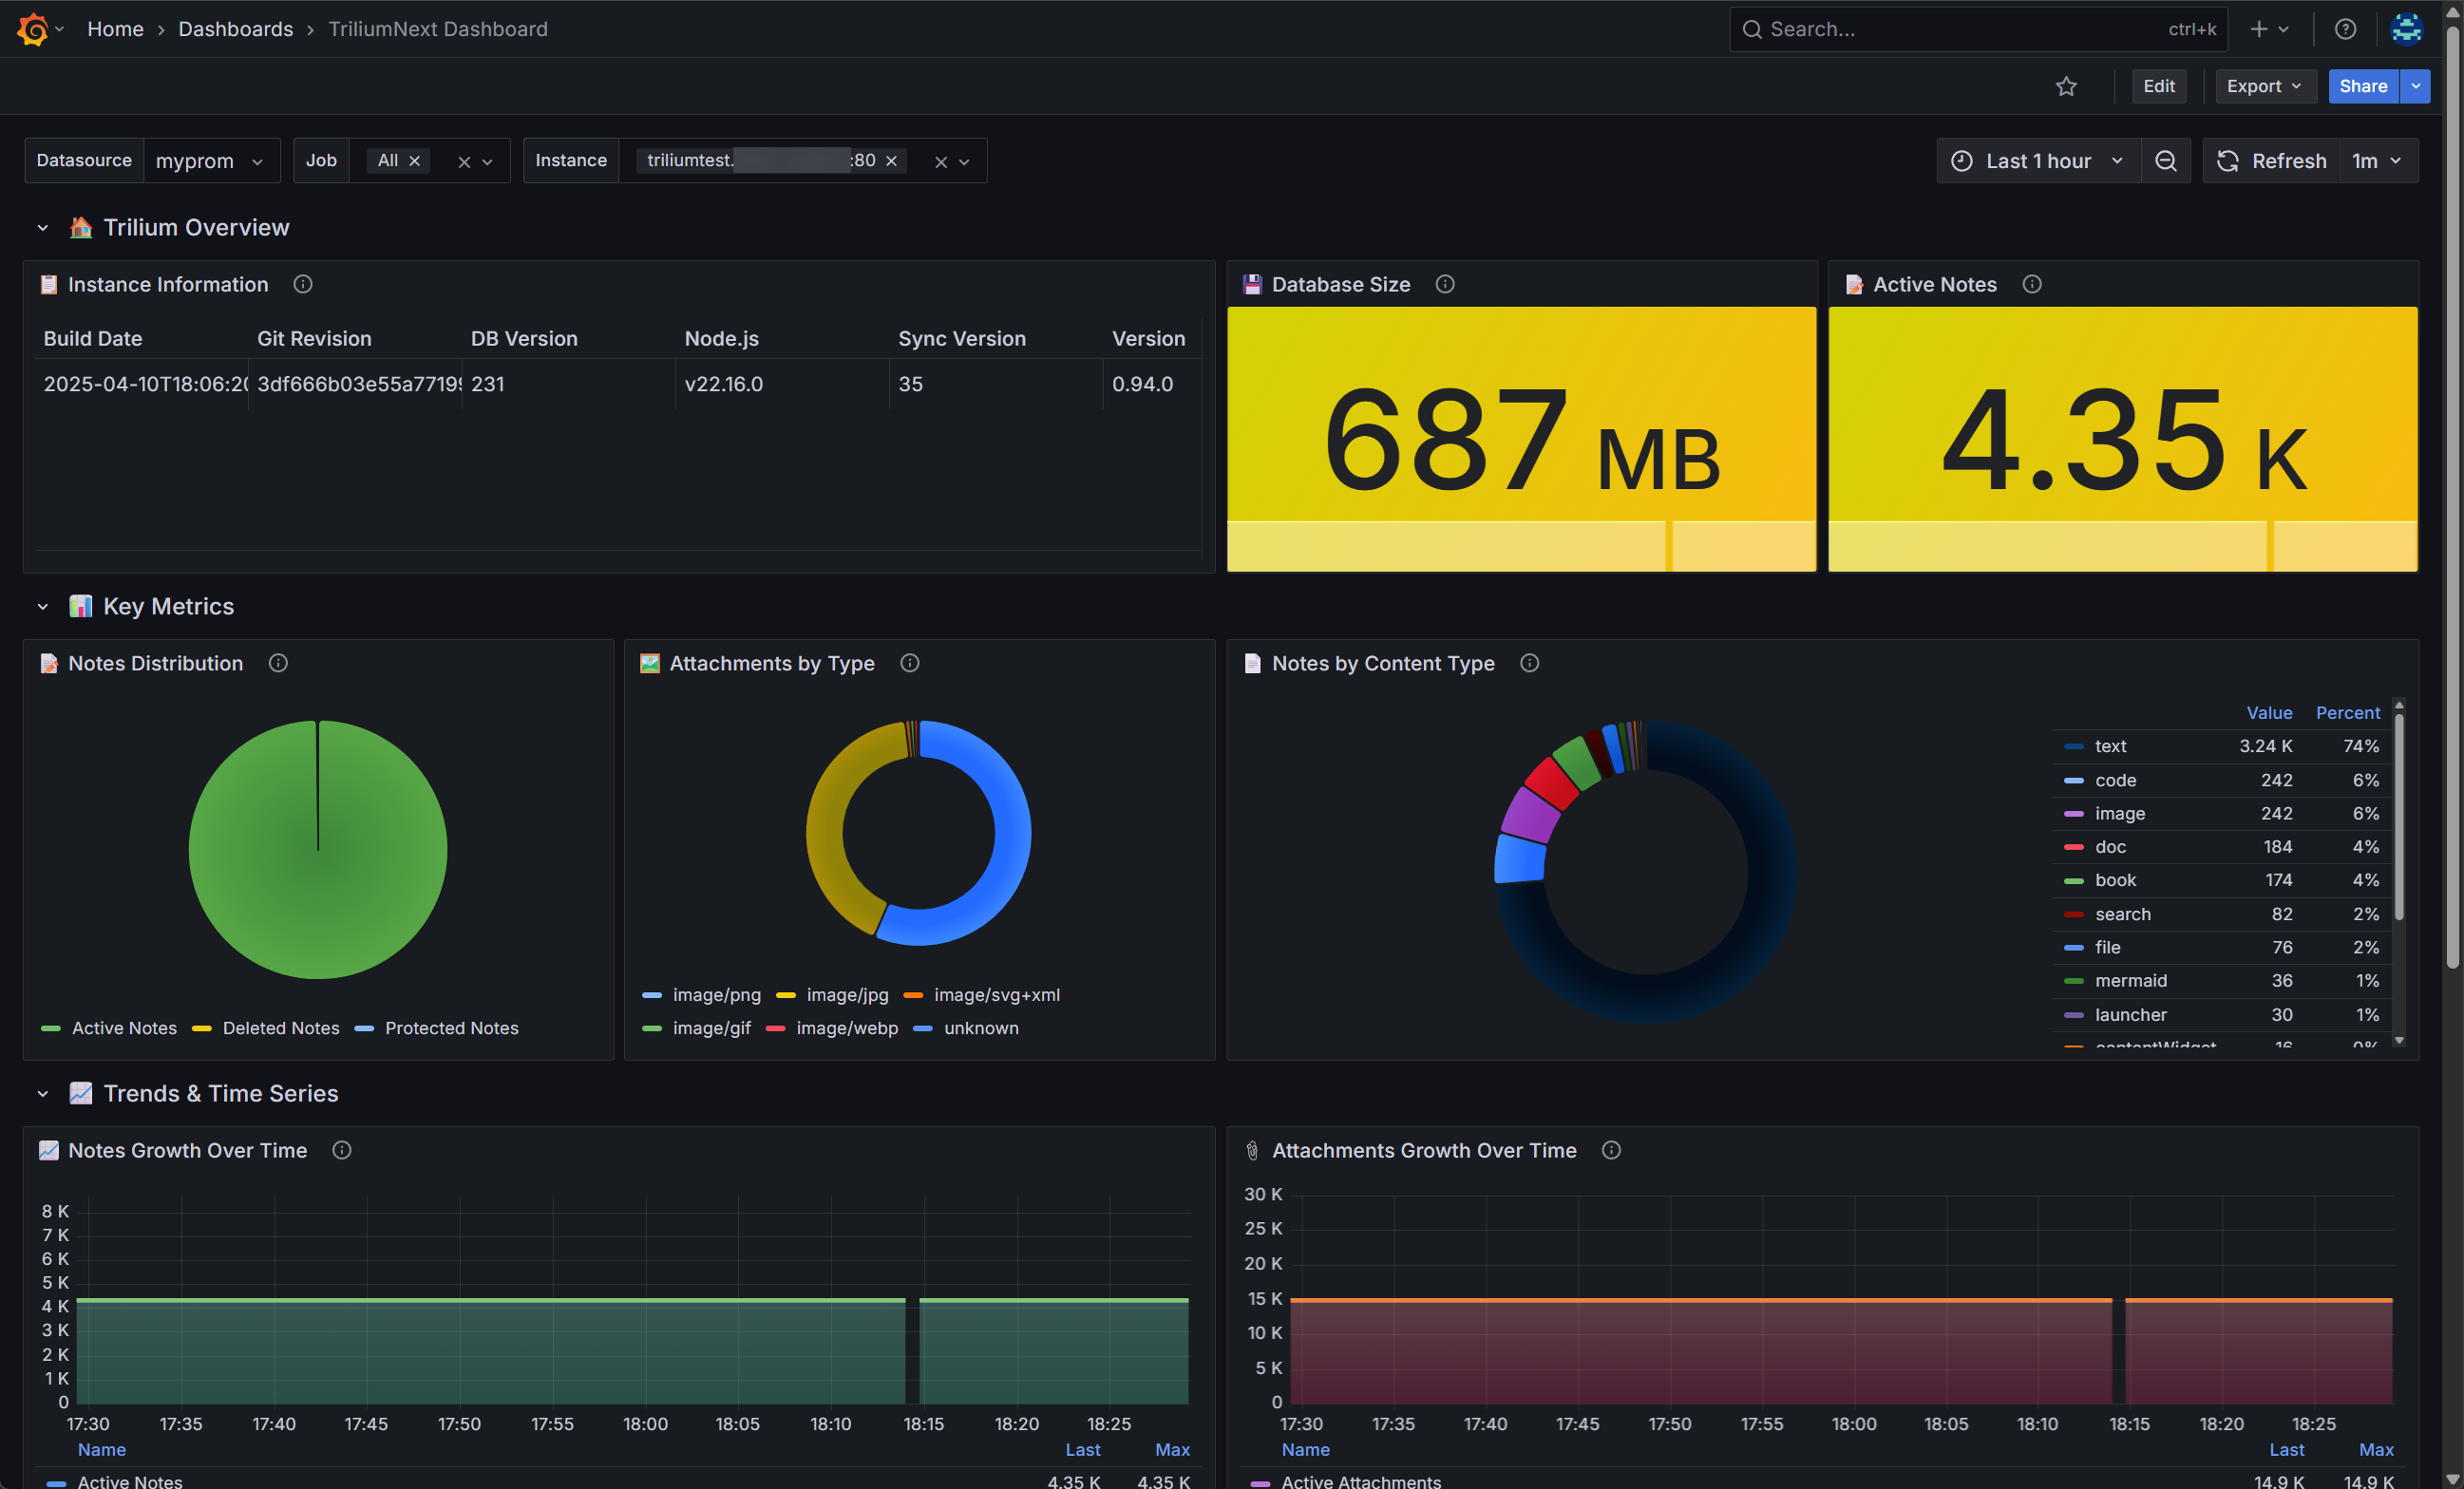
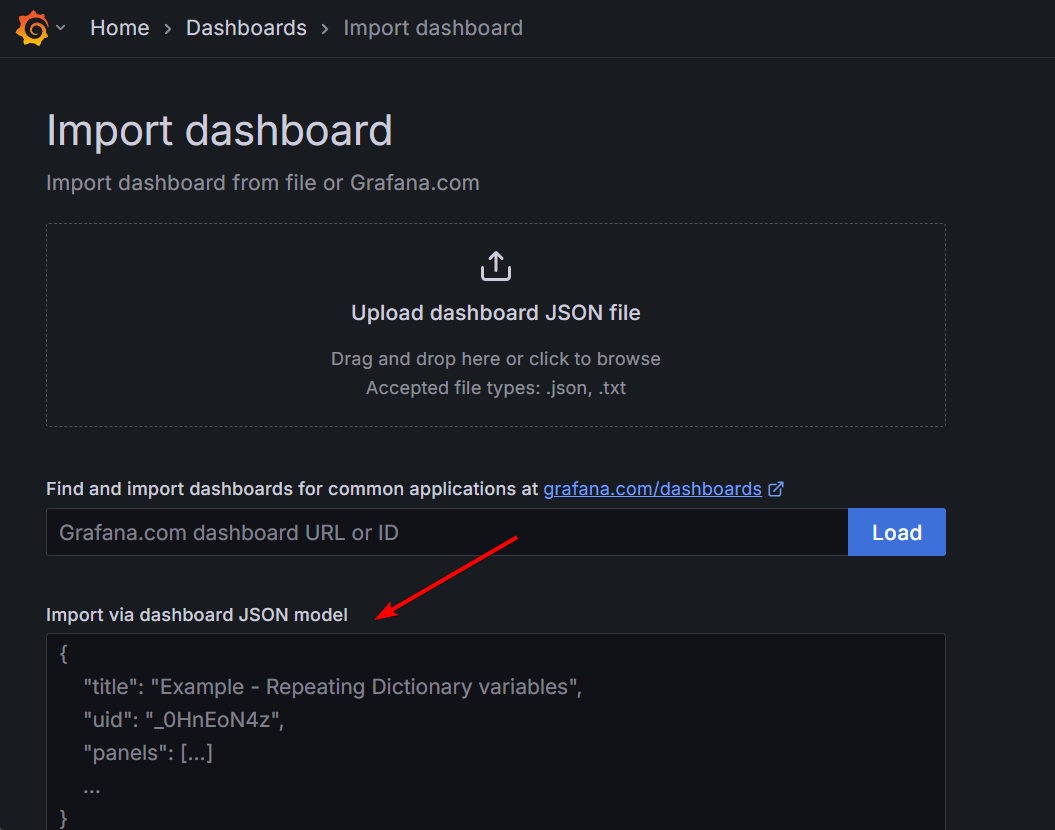
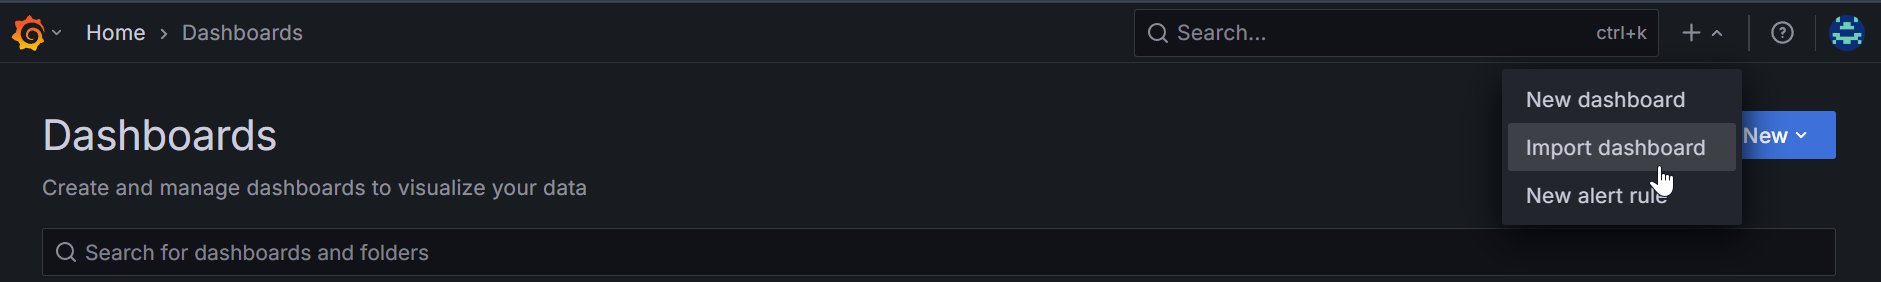
You can also use the Grafana Dashboard that has been created for TriliumNext - just take the JSON from grafana-dashboard.json and then import the dashboard, following these screenshots:
Then paste the JSON, and hit load: